As part of our website, we use cookies to provide you with the highest level of service, including services tailored to your individual needs. By continuing to use the website without changing your cookie settings, you agree to the placement of cookies on your device as described in our Privacy Policy. You can change your cookie settings in your web browser at any time. Acceptance of essential cookies is required for the proper functioning of the website. For more detailed information, please refer to our PRIVACY POLICY.
Every year, around 247,000 million cubic metres of water are abstracted from groundwater and surface water sources (streams, rivers and lakes) in the European Union.
Most of the water abstracted (44%) is used for cooling in energy production processes. The majority of this water is returned to rivers.
Food production and agriculture account for as much as 24% of extracted water resources. In southern regions, this figure can be as high as 80%.
15% of the water extracted is used in industry, whilst 17% is consumed by public water supply networks (households, public sector institutions and small businesses).
Around half of the water used in manufacturing goes to the chemical sector, with the remainder going to the metal, paper and food processing industries.
Between 2014 and 2020, 99.5 per cent of Polish rivers were found to be in poor condition
Between 2016 and 2021, good water status was found in only 13 of the 3,685 rivers surveyed (0.4%), whilst of the 1,044 lakes surveyed, only 1.1% were classified as having good water status
The proportion of surface waters in good condition in Poland fell from 31% to 8.5% over a six-year period
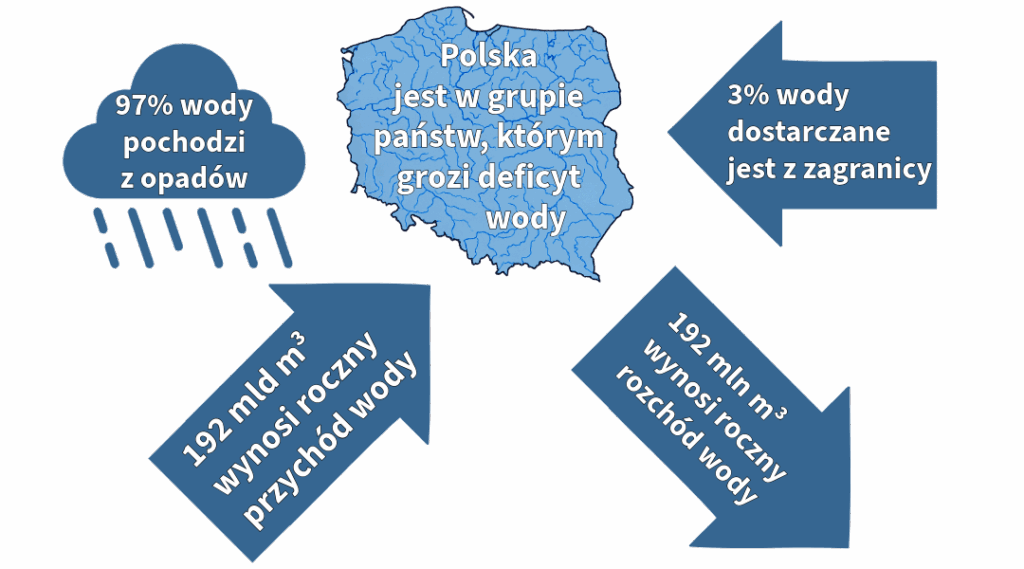
Although water resources appear to be plentiful both globally and in Poland, the situation is not good. Climate change, limited supplies of drinking water and increasing water pollution threaten the availability of water in the future. The state of water management is a cause for alarm, highlighting the importance of public education on environmental protection.
Poland is considered to be a country with relatively scarce water resources, due to: relatively low rainfall, fairly high evaporation rates, and inefficient water management.
According to a 2025 report, only 8.5 per cent of surface waters in Poland are of good quality. Poland therefore falls significantly below the EU average – on average, 40 per cent of surface waters in the EU achieve good ecological status
significant seasonal variability, resulting from variations in rainfall levels from year to year: in certain periods (years, months), excessive rainfall is observed, leading to flooding; in other periods, prolonged droughts cause water shortages and, consequently, a drop in the water table and reduced agricultural yields